matplotlib 으로 고도에 따른 중력의 그래프를 그리기
조회수 587회
N = 80
z = np.zeros((N,2))
for h in range(0,80,1):
z[h,0] = h
#constants
mass_earth = 5.9722*10**(24) #[kg]
radius_earth = 6371*10**(3) #[m]
universal_gravitational_const = 6.674*10**(-11) #[m^3/kg^-1*s^2]
standard_gravity = 9.80665 #[m/s^2]
#calculation
local_gravity = (universal_gravitational_const*mass_earth)/((radius_earth+h))**(2)
z[h,1] = local_gravity
plt.title('Gravitational Acceleration at Different Altitudes',fontsize=12)
plt.ylabel('Altitude in [km]',fontsize=10)
plt.xlabel('Gravitational Acceleration [m/s²]',fontsize=10)
plt.axis([9.5,9.85,0,80])
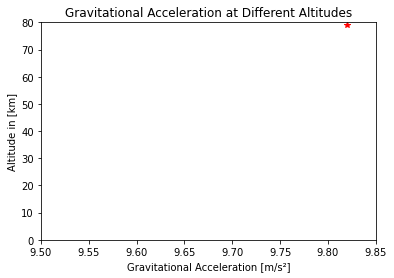
plt.plot(z[h,1],z[h,0],'r*')
plt.show()
안녕하세요, 진짜 단순한 문제인거 같은데 도대체 저는 알아내지 못하겠어서 질문드립니다. 그래프에 x축은 계산된 중력, y축은 고도를 하나하나 나타내고 싶은데 그래프에 표시하려고 하면 아래 사진처럼 찍힙니다.
도와주세요.
-
-
(•́ ✖ •̀)
알 수 없는 사용자 - 〉

2 답변
-
-
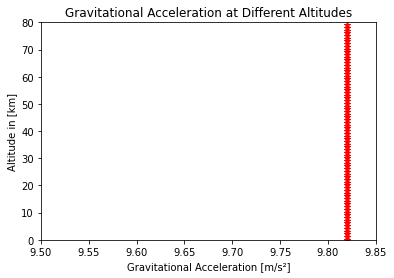
plt.plot(z[h,1],z[h,0],'r*')을plt.plot(z[:,1],z[:,0],'r*')으로 수정하세요.import numpy as np import matplotlib.pyplot as plt N = 80 z = np.zeros((N,2)) for h in range(0,80,1): z[h,0] = h #constants mass_earth = 5.9722*10**(24) #[kg] radius_earth = 6371*10**(3) #[m] universal_gravitational_const = 6.674*10**(-11) #[m^3/kg^-1*s^2] standard_gravity = 9.80665 #[m/s^2] #calculation local_gravity = (universal_gravitational_const*mass_earth)/((radius_earth+h))**(2) z[h,1] = local_gravity plt.title('Gravitational Acceleration at Different Altitudes',fontsize=12) plt.ylabel('Altitude in [km]',fontsize=10) plt.xlabel('Gravitational Acceleration [m/s²]',fontsize=10) plt.axis([9.5,9.85,0,80]) plt.plot(z[:,1],z[:,0],'r*') plt.show()- 결과
-
(•́ ✖ •̀)
알 수 없는 사용자
댓글 입력