from sklearn.datasets import load_boston
boston = load_boston()
from matplotlib import pyplot as plt
plt.scatter(boston.data[:,5], boston.target, color='r')
import numpy as np
x = boston.data[:,5]
x = np.array([[v,1] for v in x])
y = boston.target
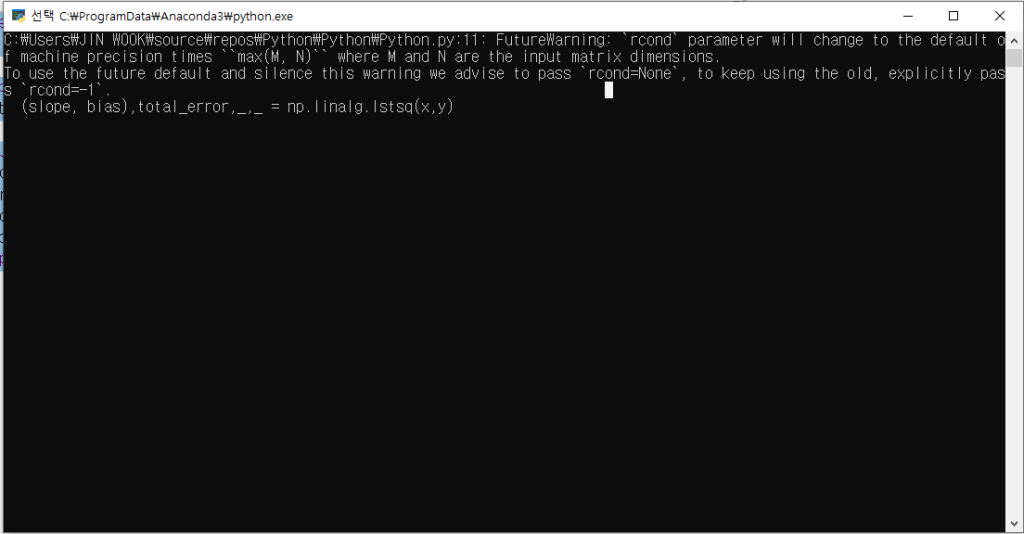
(slope, bias),total_error,_,_ = np.linalg.lstsq(x,y)
rmse = np.sqrt(total_error[0] / len(x))
예제공부중에 보스턴 주택 데이터 가져와서 그래프로 보여주는 문제인데 위 코드를 입력하면
'rcond' parameter will change to the default of machine precision times ''max(m,n)'' where m and n are the input matrix dimensions.
To use the future default and silence this warning we advise to pass 'rcond=None', to keep using the old, explicitly pass 'rcond=-1'.
라고 나옵니다 ..
그 다음 (slope, bias),total_error,_,_ = np.linalg.lstsq(x,y) 얘만 프린트 되어나오는데
무슨말인지 이해가 안되기도하고 그래프로 왜 나타나지 않는 것인가요?