import pandas as pd
import numpy as np
import datetime

import sys
from openpyxl import load_workbook
sys.path.append("C:\\pytest")
df= pd.read_excel('C:\\pytest\\dailyprice.xlsx', sheet_name='dprice')

No_List = ["Date", "Year", "Month"]

df.head()

df.columns

for x in range(0,len(df.columns),2):
    temp_df = df[[df.columns[x], df.columns[x+1]]]
    temp_df = temp_df.fillna(method='bfill').dropna()
    temp_df.columns = ['Date', 'Data']
    temp_df['Date'] = pd.to_datetime(temp_df['Date']).apply(lambda x: x.date())
    print(temp_df)
안녕하세요.
특정 시트에 일별 가격 데이터를 수집하고 있는데 이 가격을 주별, 월별 평균 가격을 구하고 싶어서 파이썬 resample 로 변환한 후 별도 시트로 자료를 이동하려고 합니다.
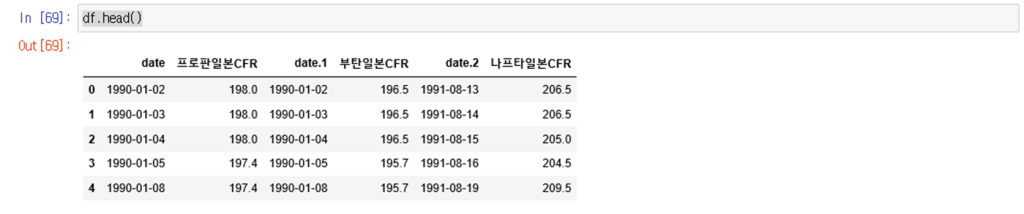
df는 위와 같은 자료로 구성되어 있으며 한 시트에 2열로 날짜와 가격 데이터가 있어 for 문을 이용하여 date와 data로 나누었습니다. 여기서 질문이 있습니다.

print(temp_df)를 하면 3가지 데이터가 표시되는데temp_df는 3번째 데이터만 표시되는 이유가 무언가요?- 저 자료를 별도 시트에 date, data 2열씩 이동하는 방법이 궁금합니다.
감사합니다.