도와주세요 ..선형회귀분석 함수, 영어단어의 특성과 단어의 사용 빈도수
조회수 835회
<문제>
영어단어의 특성과 단어의 사용 빈도수 두 번째 프로젝트에서는 약 1억 개의 영어 단어로 구성된 British National Corpus (BNC) 텍스트 코퍼스(단어모음)를 다루어봅니다.
words.txt 파일에 저장된 단어 10,000개의 빈도수를 그래프로 시각화한 후 선형회귀법을 적용해보겠습니다. 주석을 읽고 실행 결과가 출력되도록 do_linear_regression() 함수를 완성하세요.
<과제>
주석과 함께 코드를 이해하고 각 함수의 리턴값을 확인하세요.
do_linear_regression() 함수를 작성하세요 (44번째 줄).
실행 버튼을 누르고 출력되는 차트를 확인하세요.
main() 함수에서 21, 22번째 줄의 주석을 해제하세요. 실행 버튼을 누르고 새롭게 출력되는 차트를 확인하세요.
출력된 그래프와 아래 [실행 결과] 를 비교해본 후 제출 버튼을 눌러보세요.
<코드>
import operator from sklearn.linear_model import LinearRegression import numpy as np import matplotlib matplotlib.use('Agg') import matplotlib.pyplot as plt import elice_utils
def main(): words = read_data()
***# words.txt 단어를 빈도수 순으로 정렬합니다.
words = sorted(____)***

# 정수로 표현된 단어를 X축 리스트에, 각 단어의 빈도수를 Y축 리스트에 저장합니다.
X = list(range(1, len(words)+1))
Y = [x[1] for x in words]


# X, Y 리스트를 array로 변환한 후 각 원소 값에 log()를 적용합니다.
X, Y = np.array(X), np.array(Y)
X, Y = np.log(X), np.log(Y)

# 기울기와 절편을 구한 후 그래프와 차트를 출력합니다.
slope, intercept = do_linear_regression(X, Y)
draw_chart(X, Y, slope, intercept)

return slope, intercept
read_data() - words.txt에 저장된 단어와 해당 단어의 빈도수를 리스트형으로 변환합니다.
def read_data():
*# words.txt 에서 단어들를 읽어,
# [[단어1, 빈도수], [단어2, 빈도수] ... ]형으로 변환해 리턴합니다.
words = []*


return words
do_linear_regression() - 임포트한 sklearn 패키지의 함수를 이용해 그래프의 기울기와 절편을 구합니다.
def do_linear_regression(X, Y): # do_linear_regression() 함수를 작성하세요.
return (slope, intercept)
draw_chart() - matplotlib을 이용해 차트를 설정합니다.
def draw_chart(X, Y, slope, intercept): fig = plt.figure() ax = fig.add_subplot(111) plt.scatter(X, Y)
# 차트의 X, Y축 범위와 그래프를 설정합니다.
min_X = min(X)
max_X = max(X)
min_Y = min_X * slope + intercept
max_Y = max_X * slope + intercept
plt.plot([min_X, max_X], [min_Y, max_Y],
         color='red',
         linestyle='--',
         linewidth=3.0)

# 기울과와 절편을 이용해 그래프를 차트에 입력합니다.
ax.text(min_X, min_Y + 0.1, r'$y = %.2lfx + %.2lf$' % (slope, intercept), fontsize=15)

plt.savefig('chart.png')
elice_utils.send_image('chart.png')
if name == "main": main()
세가지 파트를 작성해야 하는데.하나도 모르겠네요...도와주세요..ㅠㅠㅠ
-
(•́ ✖ •̀)
알 수 없는 사용자
1 답변
-
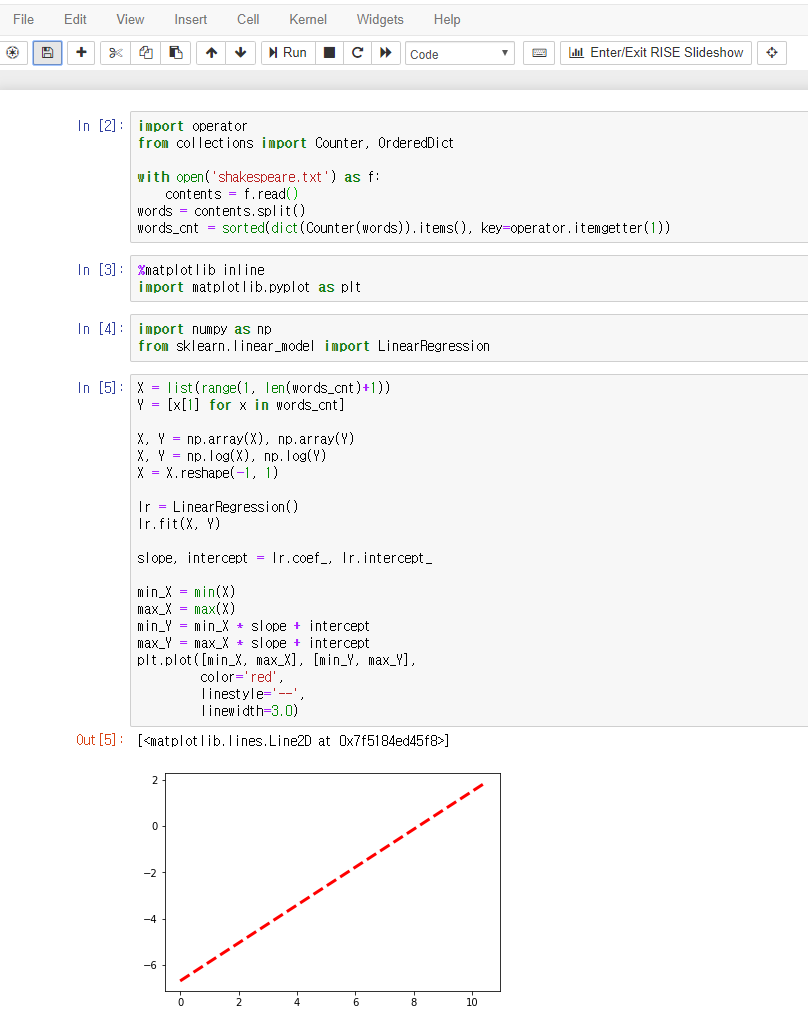
feature 가 1개인 선형모델이니 w 1개하고 바이어스만 구하면 1차 그래프를 그릴 수 있습니다.
words.txt 가 없어서 세익스피어 파일을 가지고 워드 추출해서 테스트 했습니다.
아래 노트북보고 옮기시기 바랍니다.
https://notebooks.azure.com/wincommerce/projects/hashcode/html/9326.ipynb
- shakespeare 파일
https://notebooks.azure.com/wincommerce/projects/hashcode/html/shakespeare.txt

댓글 입력